| OWL SOFTWARE | |
|
Customers are increasingly requesting digital and hard-copy documentation of their fiber
installations for many reasons: simple archiving, compliance with company-wide quality
standards, or even when applying for long-term cabling system warranties.
Printed test reports not only provide customers with proof of the quality of their installed fiber, these reports also serve as an installer's proof of a job well done in case of disputes. Most modern fiber optic test equipment -- including OWL test equipment -- is capable of internally storing test results which can be downloaded into a computer for later retrieval or printing test reports. OWL software requires a Pentium-class PC or better running Windows 98 or later. Below is a list of the various OWL software programs. |
|
| OWLVIEW |
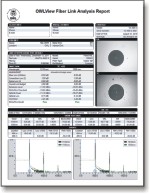
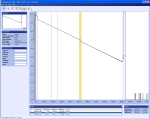
Sample TRI-report Screenshot  Windows OWLView Software Screenshot (OTDR) 
|
|
OWLView software
covers two product lines: Fiber OWL 7 series
certification testers, and OWLTrek OTDRs. *** Windows PC required for installation *** For Fiber OWL 7 series certification testers, OWLView software is used to view, manage, and store Fiber OWL 7 test kit projects (which includes certification, OTDR, and endface analysis results), and print TRI-reports. Applicable products: For OWLTrek OTDRs, OWLView software is used to view, manage, and store OWL OTDR trace files, export traces to .SOR version 2 format, and print trace reports. Users can view traces, and zoom in on events for close event analysis. Applicable products: |
|
| OWL REPORTER |
 click for more information |
|
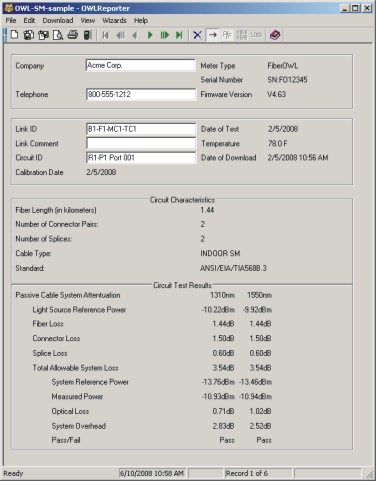
OWL Reporter is used to view, manage, and store OWL certification test results, and produce
summary and detail fiber link certification reports based on popular national and international
fiber cabling standards such as TIA-568.
Applicable products: |
|
| OWLVIEW FOR OCM |

click for more information |
|
OWLView for OCM software is used to view, manage, and store WDM channel data taken with OWL
OCM (optical channel monitor) products.
*** Windows PC required for installation *** Data is presented as a bar graph, and in tabular format. Applicable products:
|
|


